I have been used many monitoring tools for over 4 years, but there has never been a tool which is so strongly strike my heart and meet my needs in the just right way. Most of them are focusing more on the so-called extensible back-end storage, but not many of them has really meet the requirement of monitoring out of box. Of course, that could be the secret of their business money making.
Anyway, most of this article follows https://hostpresto.com/community/tutorials/how-to-install-and-configure-ganglia-monitor-on-ubuntu-16-04/ , just to give myself a quick notes to apply.
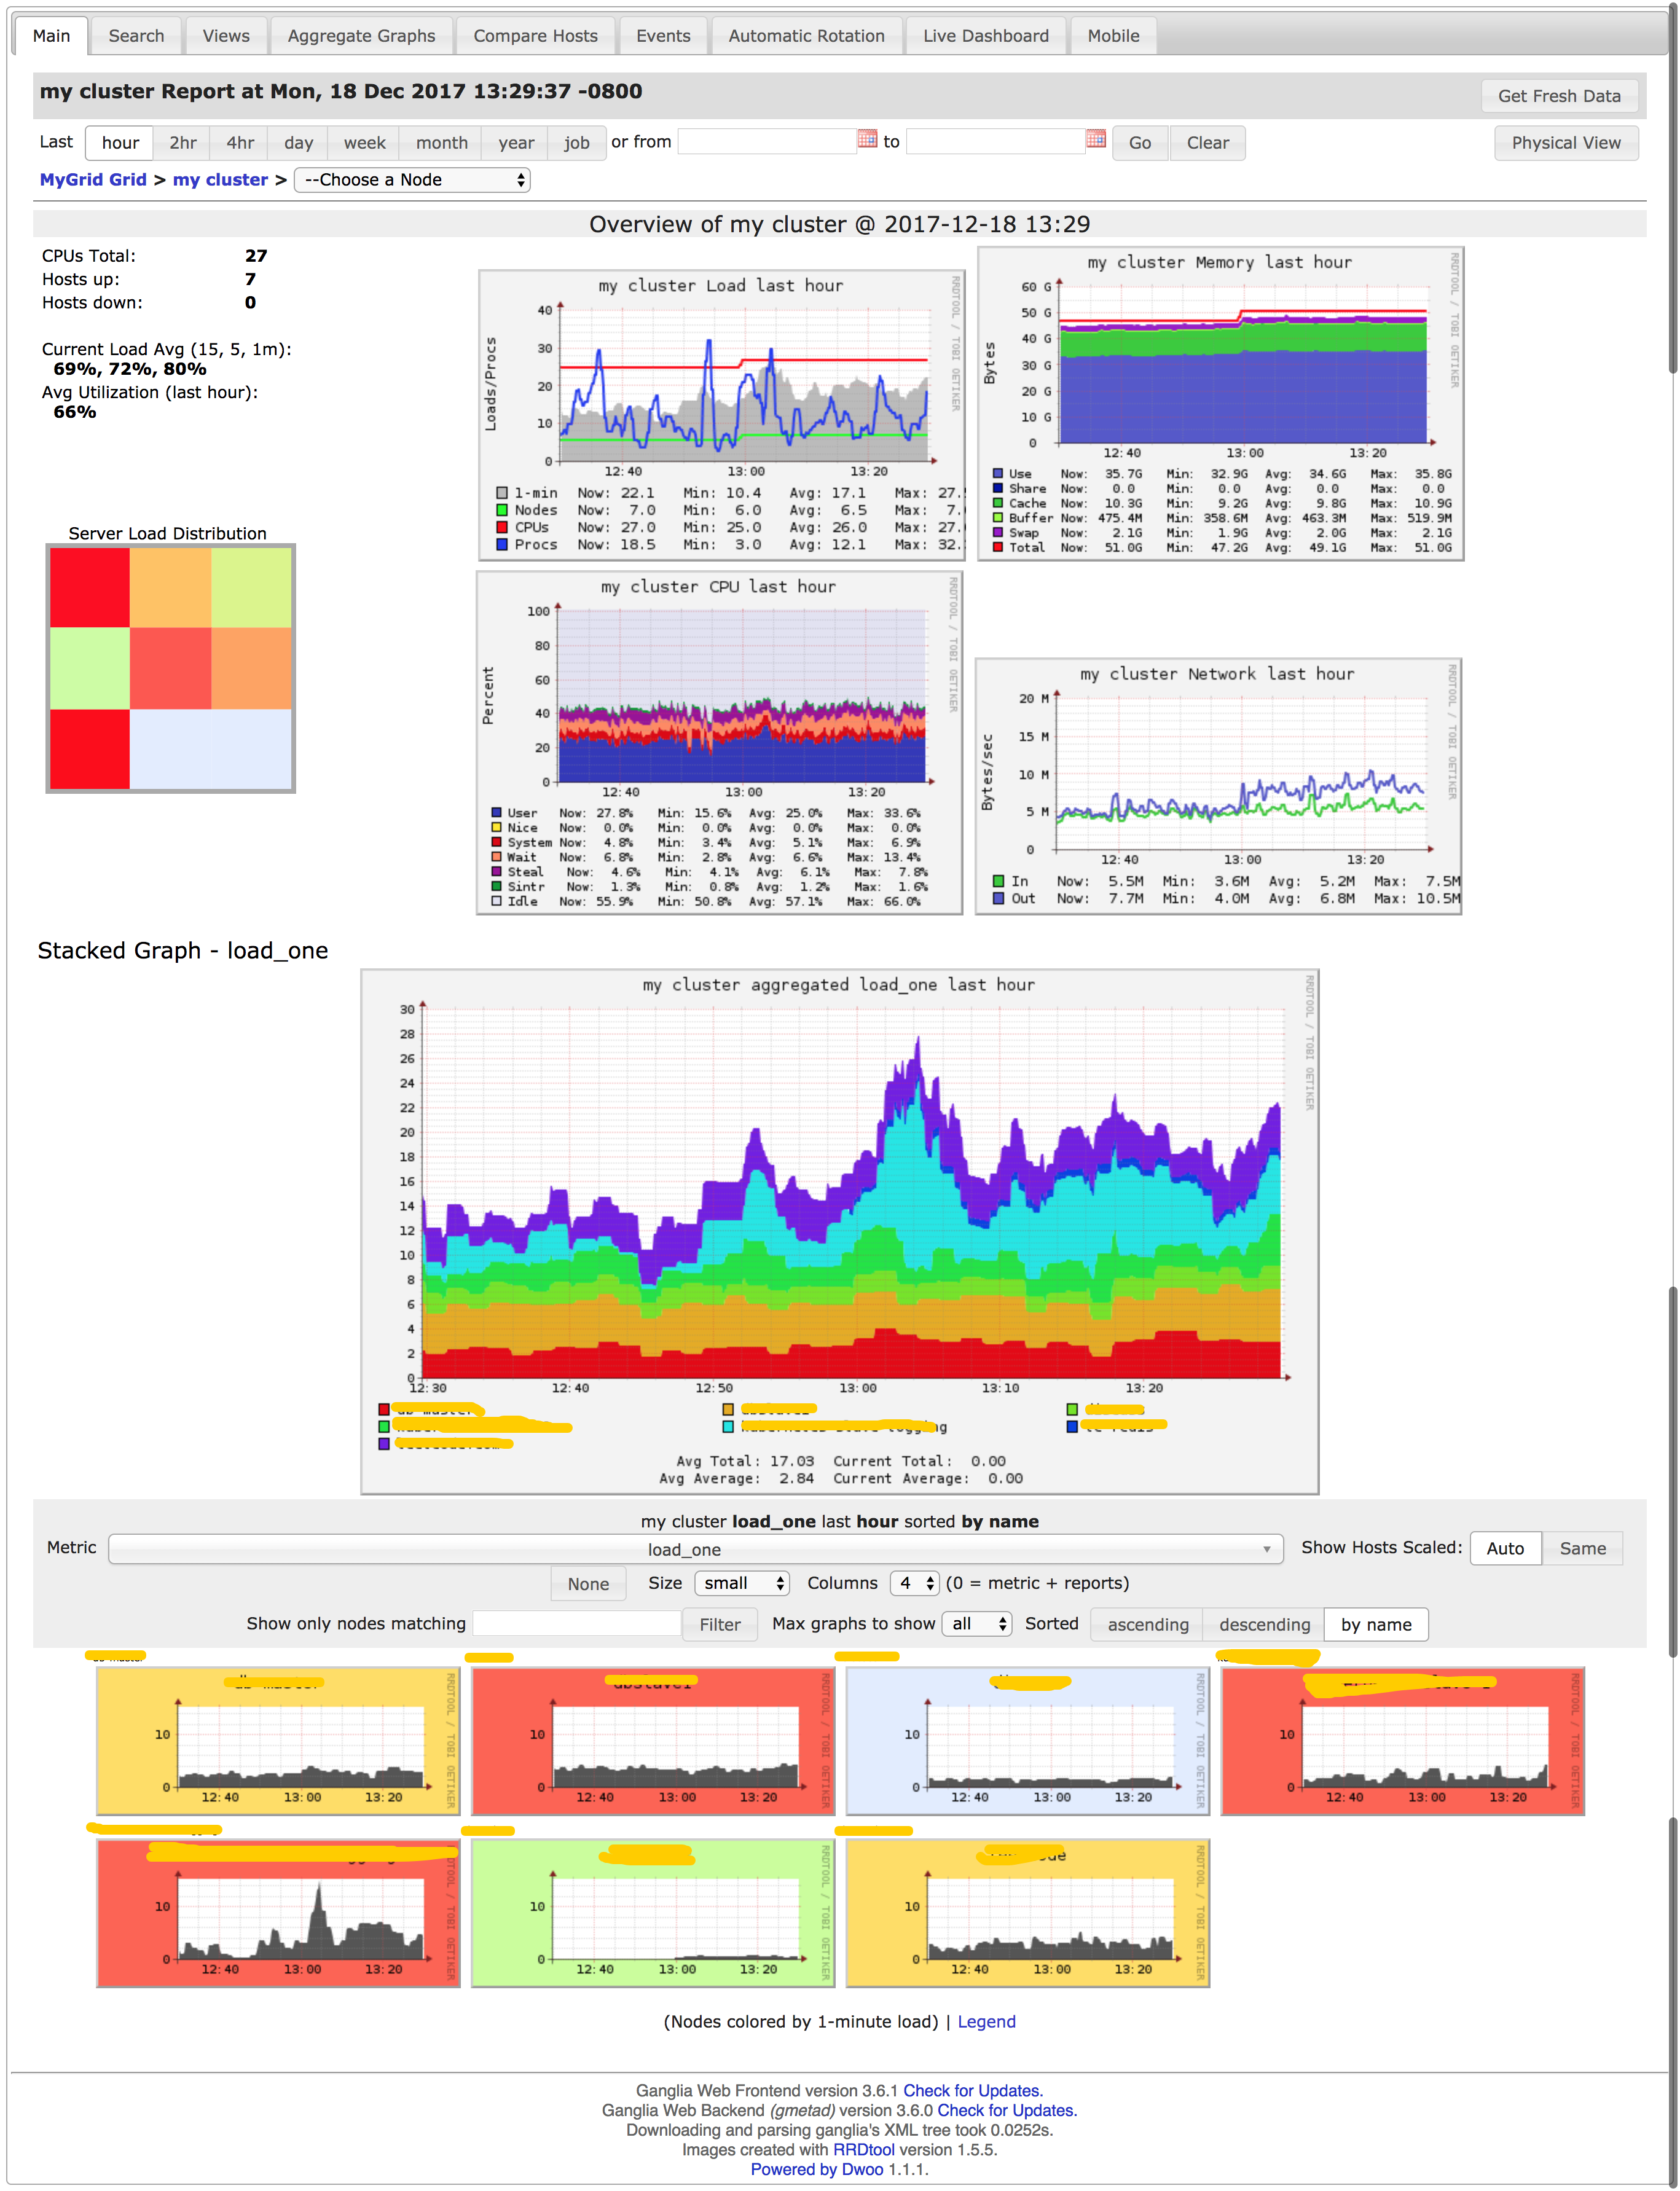
Long time that no pictures, I love pictures. Here is one for you to enjoy:

This post assume you have a Ubuntu 16.04 OS, for CentOS, please note, the service name is a little different, but components should be the same:
- gmond + gmond-python modules
- gmetad + rrdtool + rrdcache(optional) + web front
1. How Ganlia works?
- Ganglia Monitoring Daemon(
gmond) collect data from the server itself and then send to one Ganglia Meta Daemon(gmetad) server to aggregate the data. gmetadwill save those data intorrdson disk. (flush to disk)gmetadaggregation data could comes from agmonddata.- a lower level of
gmetadcould send data to a higher level ofgmetadnode to form a multi-level gmetad cluster, to form as a cluster environment, to make sure such monitoring system as scalable asseveral thousandsof server nodes.
- Ganglia PHP Web Front-end will fetch
rrdsdata and display on web page.
2. Install Ganglia Meta Daemon Node
2.1. Update System
1 | sudo apt-get update -y sudo apt-get upgrade -y |
This is easy, I and you will skip this.
2.2. Install LAMP Stack on Master node (gmetad node)
Actally we don’t need even mariadb here. Only PHP7 and Apache2 related are required.1
2sudo apt-get install apache2 php7.0 libapache2-mod-php7.0 php7.0-mbstring php7.0-curl php7.0-zip php7.0-gd php7.0-curl php7.0-mcrypt
sudo apt-get install mariadb-server php7.0-mysql # this is not required
2.3. Install Gmetad Node Component
1 | apt-get install ganglia-monitor ganglia-monitor-python gmetad ganglia-webfrontend -y |
2.4. Gmetad Config udpate
By default, using data_source "my cluster" localhost and gridname "MyGrid" as localhost:8649 datasource and MyGrid grid.
2.5. Ganglia-Web Update
1 | # vi /etc/apache2/sites-enabled/ganglia.conf |
Also, please generate one /etc/apache2/sites-enabled/.htpasswd using1
htpasswd -c /etc/apache2/sites-enabled/.htpasswd <admin_user>
2.6. Install rrdcached to solve large IOPS issue
1 | apt-get install rrdcached -y |
After installing rrdcached, you will see a line1
DEFAULT=/etc/default/rrdcached
in /etc/init.d/rrdcached, which means start options are defined in file /etc/default/rrdcached.
2.7. Configure Update After Installing rrdcached
Change
BASE_OPTIONSin/etc/default/rrdcached
Change the last line from1
BASE_OPTIONS="-B"
into
1
2
3BASE_OPTIONS="-s www-data -m 664 -l unix:/tmp/rrdcached.sock \
-s nogroup -m 777 -P FLUSH,STATS,HELP,FETCH -l unix:/tmp/rrdcached.limited.sock \
-b /var/lib/ganglia/rrds -B"It means:
- for
www-datauser has644permission fromunix:/tmp/rrdcached.socksock, - but for
nogroupusers, it has777permission butLIMITEDto OperationsFLUSH,STATS,HELP,FETCH, maye theFETCHis not required, and viaunix:/tmp/rrdcached.limited.socksocket, - and will flush all data into directory
/var/lib/ganglia/rrds
- for
Use
DAEMON_USER=nobodyto run the rrdcached.Change
PIDFILEpath intotmpfolder.Remove the lines whih is already defined in
BASE_OPTIONS.1
2
3
4
5#SOCKFILE=/var/run/rrdcached.sock
#BASE_PATH=/var/lib/rrdcached/db
#SOCKGROUP=root
#SOCKMODE=0660
#DAEMON_GROUP=_rrdcachedChange the permission of folders
1
2
chown -R nobody.nogroup /var/lib/ganglia/rrds
chown -R nobody.nogroup /var/lib/rrdcachedConfig Gmetad and ganglia-web
- Add
export RRDCACHED_ADDRESS="unix:/tmp/rrdcached.limited.sock"into head of/etc/init.d/gmetad Use
nobodyto startgmetadin/etc/init.d/gmetad1
2
3
4
5
6
7start)
echo -n "Starting $DESC: "
sudo -u nobody sh -c "$DAEMON --pid-file /tmp/$NAME.pid"
# start-stop-daemon --start --quiet \
# --exec $DAEMON -- --pid-file /var/run/$NAME.pid
# echo "$NAME."
;;Change
$conf['rrdcached_socket'] = "";into$conf['rrdcached_socket'] = "unix:/tmp/rrdcached.sock";in/usr/share/ganglia-webfrontend/conf_default.php
- Add
Use
nobodyto start rrdcached
In/etc/init.d/rrdcachedadd a new line usingnobodyto start therrdcached.1
2
3
4
5do_start () {
# start_daemon -p ${PIDFILE} ${DAEMON} ${RRDCACHED_OPTIONS}
su nobody -c "${DAEMON} -p ${PIDFILE} ${RRDCACHED_OPTIONS}" -s /bin/sh
return $?
}After this change, reload and restart
rrdcached.1
2systemctl daemon-reload
systemctl restart rrdcachedRestart rrdcached and check rrdcached process
1
2root@db-master:/etc/init.d# ps -ef|grep rrd
nobody 6098 1 0 07:59 ? 00:00:00 /usr/bin/rrdcached -s www-data -m 664 -l unix:/tmp/rrdcached.sock -s nogroup -m 777 -P FLUSH,STATS,HELP,FETCH -l unix:/tmp/rrdcached.limited.sock -b /var/lib/ganglia/rrds -B -j /var/lib/rrdcached/journal/ -U nobody -p /tmp/rrdcached.pid
Ref: https://github.com/ganglia/monitor-core/wiki/Integrating-Ganglia-with-rrdcached
3. Install Ganglia Monitor Node
3.1. Installation steps
1 | sudo apt-get install ganglia-monitor ganglia-monitor-python |
3.2. Ganglia Mode Config update
1 | sudo vim /etc/ganglia/gmond.conf |
Here is one sample, please read some comments below:1
2
3
4
5
6
7
8
9
10
11
12
13
14
15
16
17
18
19
20
21
22
23
24
25
26
27
28
29
30
31
32
33
34
35
36
37
38
39
40
41
42
43
44
45
46
47
48
49
50
51
52
53
54
55
56
57
58
59
60
61
62
63
64
65
66
67
68
69
70
71
72
73
74
75
76
77
78
79
80
81
82
83
84
85
86
87
88
89
90
91
92
93
94
95
96
97
98
99
100
101
102
103
104
105
106
107
108
109
110
111
112
113
114
115
116
117
118
119
120
121
122
123
124
125
126
127
128
129
130
131
132
133
134
135
136
137
138
139
140
141
142
143
144
145
146
147
148
149
150
151
152
153
154
155
156
157
158
159
160
161
162
163
164
165
166
167
168
169
170
171
172
173
174
175
176
177
178
179
180
181
182
183
184
185
186
187
188
189
190
191
192
193
194
195
196
197
198
199
200
201
202
203
204
205
206
207
208
209
210
211
212
213
214
215
216
217
218
219
220
221
222
223
224
225
226
227
228
229
230
231
232
233
234
235
236
237
238
239
240
241
242
243
244
245
246
247
248
249
250
251
252
253
254
255
256
257
258
259
260
261
262
263
264
265
266
267
268
269
270
271
272
273
274
275
276
277
278
279
280
281
282
283
284
285
286
287
288
289
290
291
292
293
294
295
296
297
298
299
300
301
302
303
304
305
306
307
308
309
310
311
312
313
314
315
316
317
318
319
320
321
322
323
324
325
326
327
328
329
330
331
332
333
334
335
336
337
338
339
340
341
342
343
344
345
346
347
348
349
350
351
352
353
354
355
356
357
358
359
360
361
362
363
364
365
366
367
368
369
370
371
372
373
374
375
376
377
378/* This configuration is as close to 2.5.x default behavior as possible
The values closely match ./gmond/metric.h definitions in 2.5.x */
globals {
daemonize = yes
setuid = yes
user = ganglia
debug_level = 0
max_udp_msg_len = 1472
mute = no
deaf = no
allow_extra_data = yes
host_dmax = 86400 /*secs. Expires (removes from web interface) hosts in 1 day */
host_tmax = 20 /*secs */
cleanup_threshold = 300 /*secs */
gexec = no
# By default gmond will use reverse DNS resolution when displaying your hostname
# Uncommeting following value will override that value.
override_hostname = "{{ ansible_hostname }}"
# If you are not using multicast this value should be set to something other than 0.
# Otherwise if you restart aggregator gmond you will get empty graphs. 60 seconds is reasonable
send_metadata_interval = 60 /*secs */
}
/*
* The cluster attributes specified will be used as part of the <CLUSTER>
* tag that will wrap all hosts collected by this instance.
*/
cluster {
name = "my cluster" /* this has to be matched with each gmond node and gmetad node.
owner = "unspecified"
latlong = "unspecified"
url = "unspecified"
}
/* The host section describes attributes of the host, like the location */
host {
location = "unspecified"
}
/* Feel free to specify as many udp_send_channels as you like. Gmond
used to only support having a single channel */
udp_send_channel {
#bind_hostname = yes # Highly recommended, soon to be default.
# This option tells gmond to use a source address
# that resolves to the machine's hostname. Without
# this, the metrics may appear to come from any
# interface and the DNS names associated with
# those IPs will be used to create the RRDs.
# mcast_join = 239.2.11.71
host = xxx.xxx.xxx.xxx /* this must be your IP Address of Gmetad */
port = 8649
ttl = 1
}
/* You can specify as many udp_recv_channels as you like as well. */
#udp_recv_channel {
# mcast_join = 239.2.11.71
# port = 8649
# bind = 239.2.11.71
# retry_bind = true
# Size of the UDP buffer. If you are handling lots of metrics you really
# should bump it up to e.g. 10MB or even higher.
# buffer = 10485760
#}
/* You can specify as many tcp_accept_channels as you like to share
an xml description of the state of the cluster */
tcp_accept_channel { /* for the node aggregation node, this needs to be open since gmetad will collect data from here, so locally. no need to open firewall rules. */
port = 8649
# # If you want to gzip XML output
# gzip_output = no
}
/* Channel to receive sFlow datagrams */
#udp_recv_channel {
# port = 6343
#}
/* Optional sFlow settings */
#sflow {
# udp_port = 6343
# accept_vm_metrics = yes
# accept_jvm_metrics = yes
# multiple_jvm_instances = no
# accept_http_metrics = yes
# multiple_http_instances = no
# accept_memcache_metrics = yes
# multiple_memcache_instances = no
#}
/* Each metrics module that is referenced by gmond must be specified and
loaded. If the module has been statically linked with gmond, it does
not require a load path. However all dynamically loadable modules must
include a load path. */
modules {
module {
name = "core_metrics"
}
module {
name = "cpu_module"
path = "modcpu.so"
}
module {
name = "disk_module"
path = "moddisk.so"
}
module {
name = "load_module"
path = "modload.so"
}
module {
name = "mem_module"
path = "modmem.so"
}
module {
name = "net_module"
path = "modnet.so"
}
module {
name = "proc_module"
path = "modproc.so"
}
module {
name = "sys_module"
path = "modsys.so"
}
}
/* The old internal 2.5.x metric array has been replaced by the following
collection_group directives. What follows is the default behavior for
collecting and sending metrics that is as close to 2.5.x behavior as
possible. */
/* This collection group will cause a heartbeat (or beacon) to be sent every
20 seconds. In the heartbeat is the GMOND_STARTED data which expresses
the age of the running gmond. */
collection_group {
collect_once = yes
time_threshold = 20
metric {
name = "heartbeat"
}
}
/* This collection group will send general info about this host*/
collection_group {
collect_every = 1200
time_threshold = 1200
metric {
name = "cpu_num"
title = "CPU Count"
}
metric {
name = "cpu_speed"
title = "CPU Speed"
}
metric {
name = "mem_total"
title = "Memory Total"
}
metric {
name = "swap_total"
title = "Swap Space Total"
}
metric {
name = "boottime"
title = "Last Boot Time"
}
metric {
name = "machine_type"
title = "Machine Type"
}
metric {
name = "os_name"
title = "Operating System"
}
metric {
name = "os_release"
title = "Operating System Release"
}
metric {
name = "location"
title = "Location"
}
}
/* This collection group will send the status of gexecd for this host
every 300 secs.*/
/* Unlike 2.5.x the default behavior is to report gexecd OFF. */
collection_group {
collect_once = yes
time_threshold = 300
metric {
name = "gexec"
title = "Gexec Status"
}
}
/* This collection group will collect the CPU status info every 20 secs.
The time threshold is set to 90 seconds. In honesty, this
time_threshold could be set significantly higher to reduce
unneccessary network chatter. */
collection_group {
collect_every = 20
time_threshold = 90
/* CPU status */
metric {
name = "cpu_user"
value_threshold = "1.0"
title = "CPU User"
}
metric {
name = "cpu_system"
value_threshold = "1.0"
title = "CPU System"
}
metric {
name = "cpu_idle"
value_threshold = "5.0"
title = "CPU Idle"
}
metric {
name = "cpu_nice"
value_threshold = "1.0"
title = "CPU Nice"
}
metric {
name = "cpu_aidle"
value_threshold = "5.0"
title = "CPU aidle"
}
metric {
name = "cpu_wio"
value_threshold = "1.0"
title = "CPU wio"
}
metric {
name = "cpu_steal"
value_threshold = "1.0"
title = "CPU steal"
}
/* The next two metrics are optional if you want more detail...
... since they are accounted for in cpu_system.
metric {
name = "cpu_intr"
value_threshold = "1.0"
title = "CPU intr"
}
metric {
name = "cpu_sintr"
value_threshold = "1.0"
title = "CPU sintr"
}
*/
}
collection_group {
collect_every = 20
time_threshold = 90
/* Load Averages */
metric {
name = "load_one"
value_threshold = "1.0"
title = "One Minute Load Average"
}
metric {
name = "load_five"
value_threshold = "1.0"
title = "Five Minute Load Average"
}
metric {
name = "load_fifteen"
value_threshold = "1.0"
title = "Fifteen Minute Load Average"
}
}
/* This group collects the number of running and total processes */
collection_group {
collect_every = 80
time_threshold = 950
metric {
name = "proc_run"
value_threshold = "1.0"
title = "Total Running Processes"
}
metric {
name = "proc_total"
value_threshold = "1.0"
title = "Total Processes"
}
}
/* This collection group grabs the volatile memory metrics every 40 secs and
sends them at least every 180 secs. This time_threshold can be increased
significantly to reduce unneeded network traffic. */
collection_group {
collect_every = 40
time_threshold = 180
metric {
name = "mem_free"
value_threshold = "1024.0"
title = "Free Memory"
}
metric {
name = "mem_shared"
value_threshold = "1024.0"
title = "Shared Memory"
}
metric {
name = "mem_buffers"
value_threshold = "1024.0"
title = "Memory Buffers"
}
metric {
name = "mem_cached"
value_threshold = "1024.0"
title = "Cached Memory"
}
metric {
name = "swap_free"
value_threshold = "1024.0"
title = "Free Swap Space"
}
}
collection_group {
collect_every = 40
time_threshold = 300
metric {
name = "bytes_out"
value_threshold = 4096
title = "Bytes Sent"
}
metric {
name = "bytes_in"
value_threshold = 4096
title = "Bytes Received"
}
metric {
name = "pkts_in"
value_threshold = 256
title = "Packets Received"
}
metric {
name = "pkts_out"
value_threshold = 256
title = "Packets Sent"
}
}
/* Different than 2.5.x default since the old config made no sense */
collection_group {
collect_every = 1800
time_threshold = 3600
metric {
name = "disk_total"
value_threshold = 1.0
title = "Total Disk Space"
}
}
collection_group {
collect_every = 40
time_threshold = 180
metric {
name = "disk_free"
value_threshold = 1.0
title = "Disk Space Available"
}
metric {
name = "part_max_used"
value_threshold = 1.0
title = "Maximum Disk Space Used"
}
}
include ("/etc/ganglia/conf.d/*.conf")
So, in a summary of this gmond conf:
globalssection defines how long we retrieve the node info and remove the dead node.udp_send_channelsection defines where to send the metricsudp_receive_channelsection has to be open, if that’s thegmetadnode, also, firewall ofudp/8649needs to be opentcp_receive_channelsection needs to be open, if that’s the aggreation node, which meansgmetadfetch thedatasourcefrom thisnode:8649usingTCPchannel
4. Restart the services
1 | # restart gmond |
5. Customized Metrics Monitoring
5.1. Port Metrics to Graphite
So we can use Pager tool like cabot to alert in using Slack/Email/Twillo, etc.
Won’t talk much about how to setup Cabot, but only port to to Graphite. As long as you already have it displayed into Graphite, you are good to use Cabot then.
The basic usage to send metrics to Graphite is1
2
3
4
5
6GRAPHITE_HOST="xxx.xxx.xxx.xxx"
GRAPHITE_PORT="2003"
now=`date +%s`
key="foo.bar"
value="1.3"
echo "$key $value $now" | nc $GRAPHITE_HOST $GRAPHITE_PORT
Then the foo.bar value is 1.3 in ganglia dashboard.
Next is the one used to collect disk_free disk left for all nodes.1
2
3
4
5
6
7
8
9
10
11
12
13
14
15
16
17
18
19
20
21
22
23
24
25
26
27
28
29
30
31
32
33
34
35
36
set -e
GRAPHITE_HOST="xxx.xxx.xxx.xxx"
GRAPHITE_PORT="2003"
KEY_PREFIX="ganglia.servers."
RRD_BASE='/var/lib/ganglia/rrds/my cluster'
cd "$RRD_BASE"
function collect_rrd() {
rrd=$1
update_date=$(rrdtool lastupdate $rrd |tail -1 |cut -d ':' -f1)
now=`date +%s`
delta=$((now-update_date))
if [ $delta -lt 20 ]; then
# got the data
key=$(echo $rrd|sed -E 's/\.rrd//g'|sed -E 's/\.\///g'|tr '/' '.' )
key="$KEY_PREFIX$key"
value=$(rrdtool lastupdate $rrd |tail -1 |cut -d ':' -f2)
# echo "key:$key, value:$value, ts: $update_date"
echo "$key $value $update_date" | nc $GRAPHITE_HOST $GRAPHITE_PORT
fi
}
function disk_free_monitor() {
for rrd in `find . |grep disk_free_abs|grep -vE '(__Sum|token|run|dev|cgroup|var_lib_docker)'`; do
collect_rrd $rrd
done
}
while true;
do
disk_free_monitor
# echo "sleep 15 seconds..."
sleep 15
done
You probably need to add this monitor.sh into crontab so that it can be auto start after rebooting the machine.1
2# crontab -e
@reboot /root/monitor.sh > /dev/null 2>&1
5.2. Create dashboard graph from Graphite
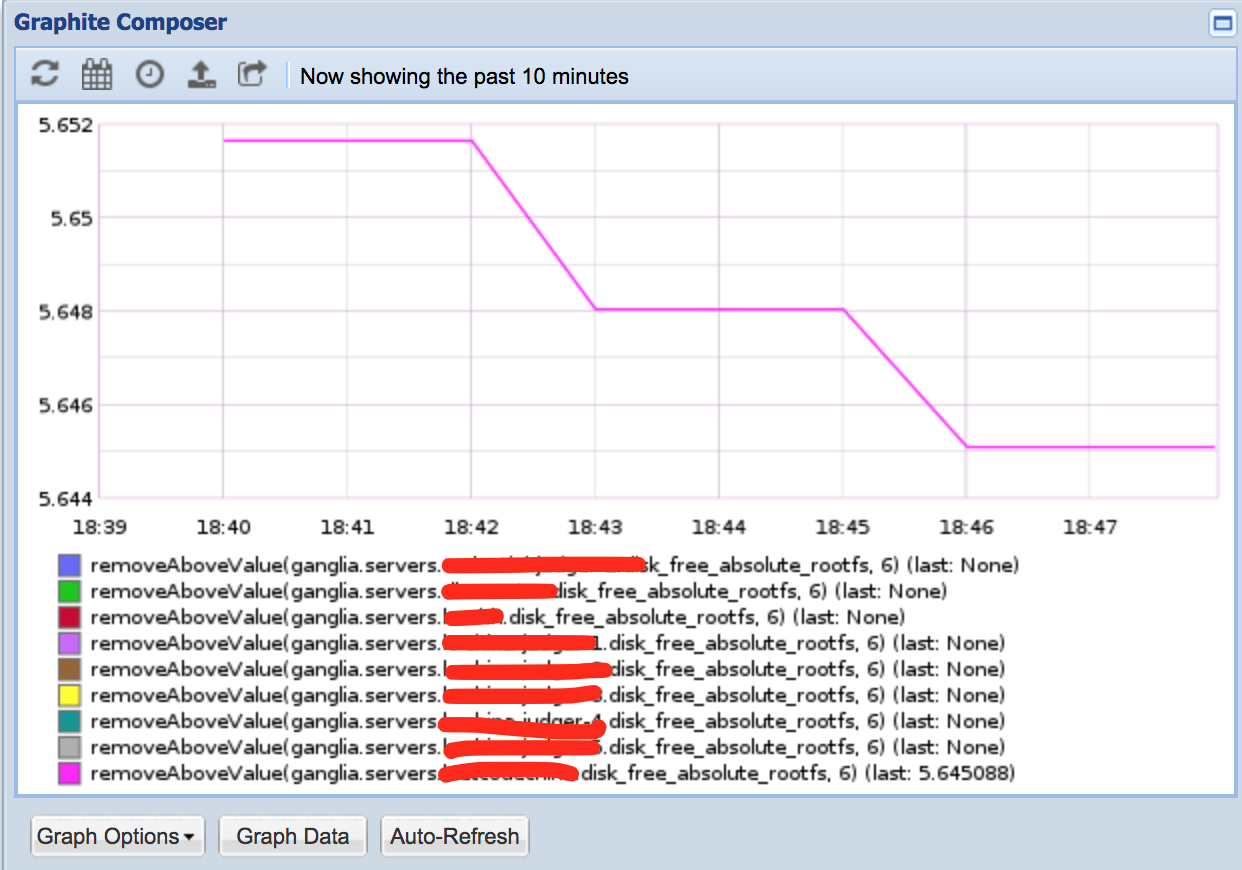
Finally I used
1
legendValue(removeAboveValue(ganglia.servers.*.disk_free_absolute_*,6),"last")
to create the graph from graph composer of Graphite.

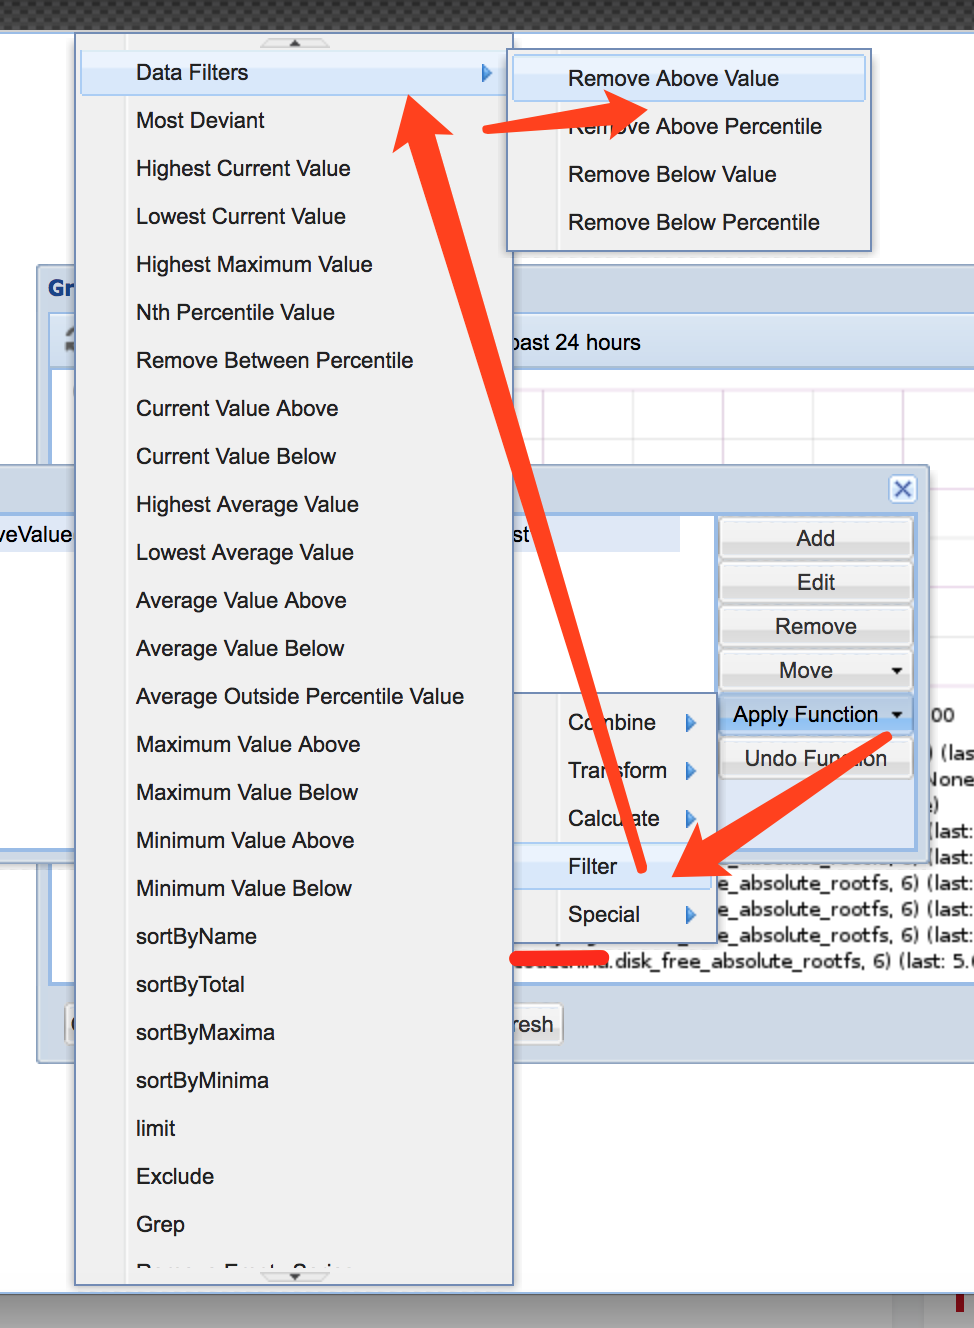
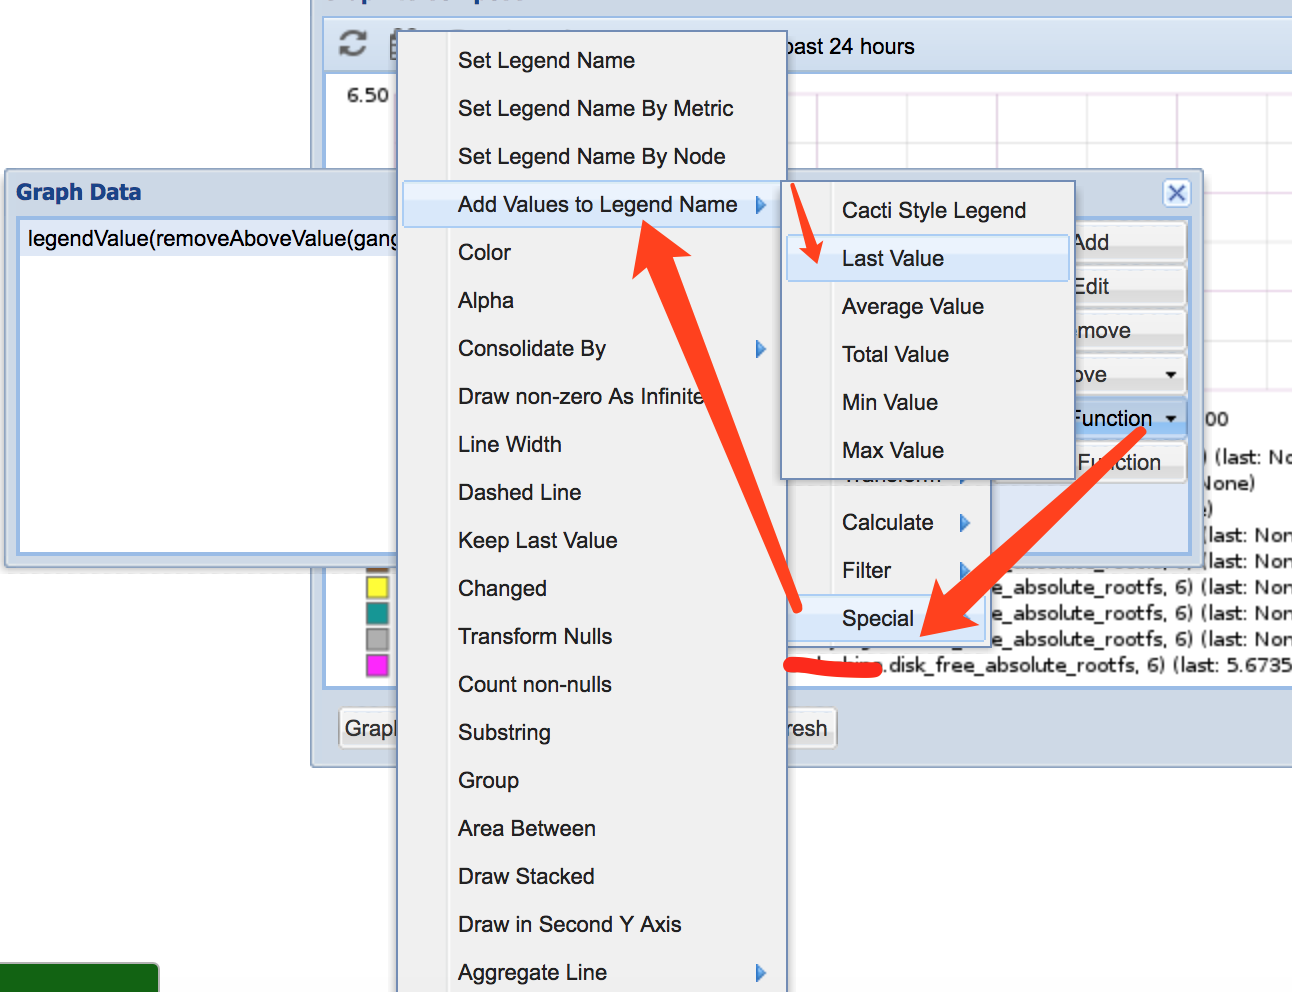
The most tricky part is the functions that I got to use:
removeAboveValue: if some value are above the value, just remove the line from graph, because we only care about those disks that has lower valuelegendValue: put the value into part of the legend, can quickly locate the value if some value is below a threshold


Please try different functions as much as possible to understand what the underlying meaning.
5.3. Add Graphite Check from Cabot
Because Cabot has a strong connection to Graphite, so that’s why we have to put the metrics into Graphite firstly. Only by doing that, we are able to do the check from Cabot.

References: