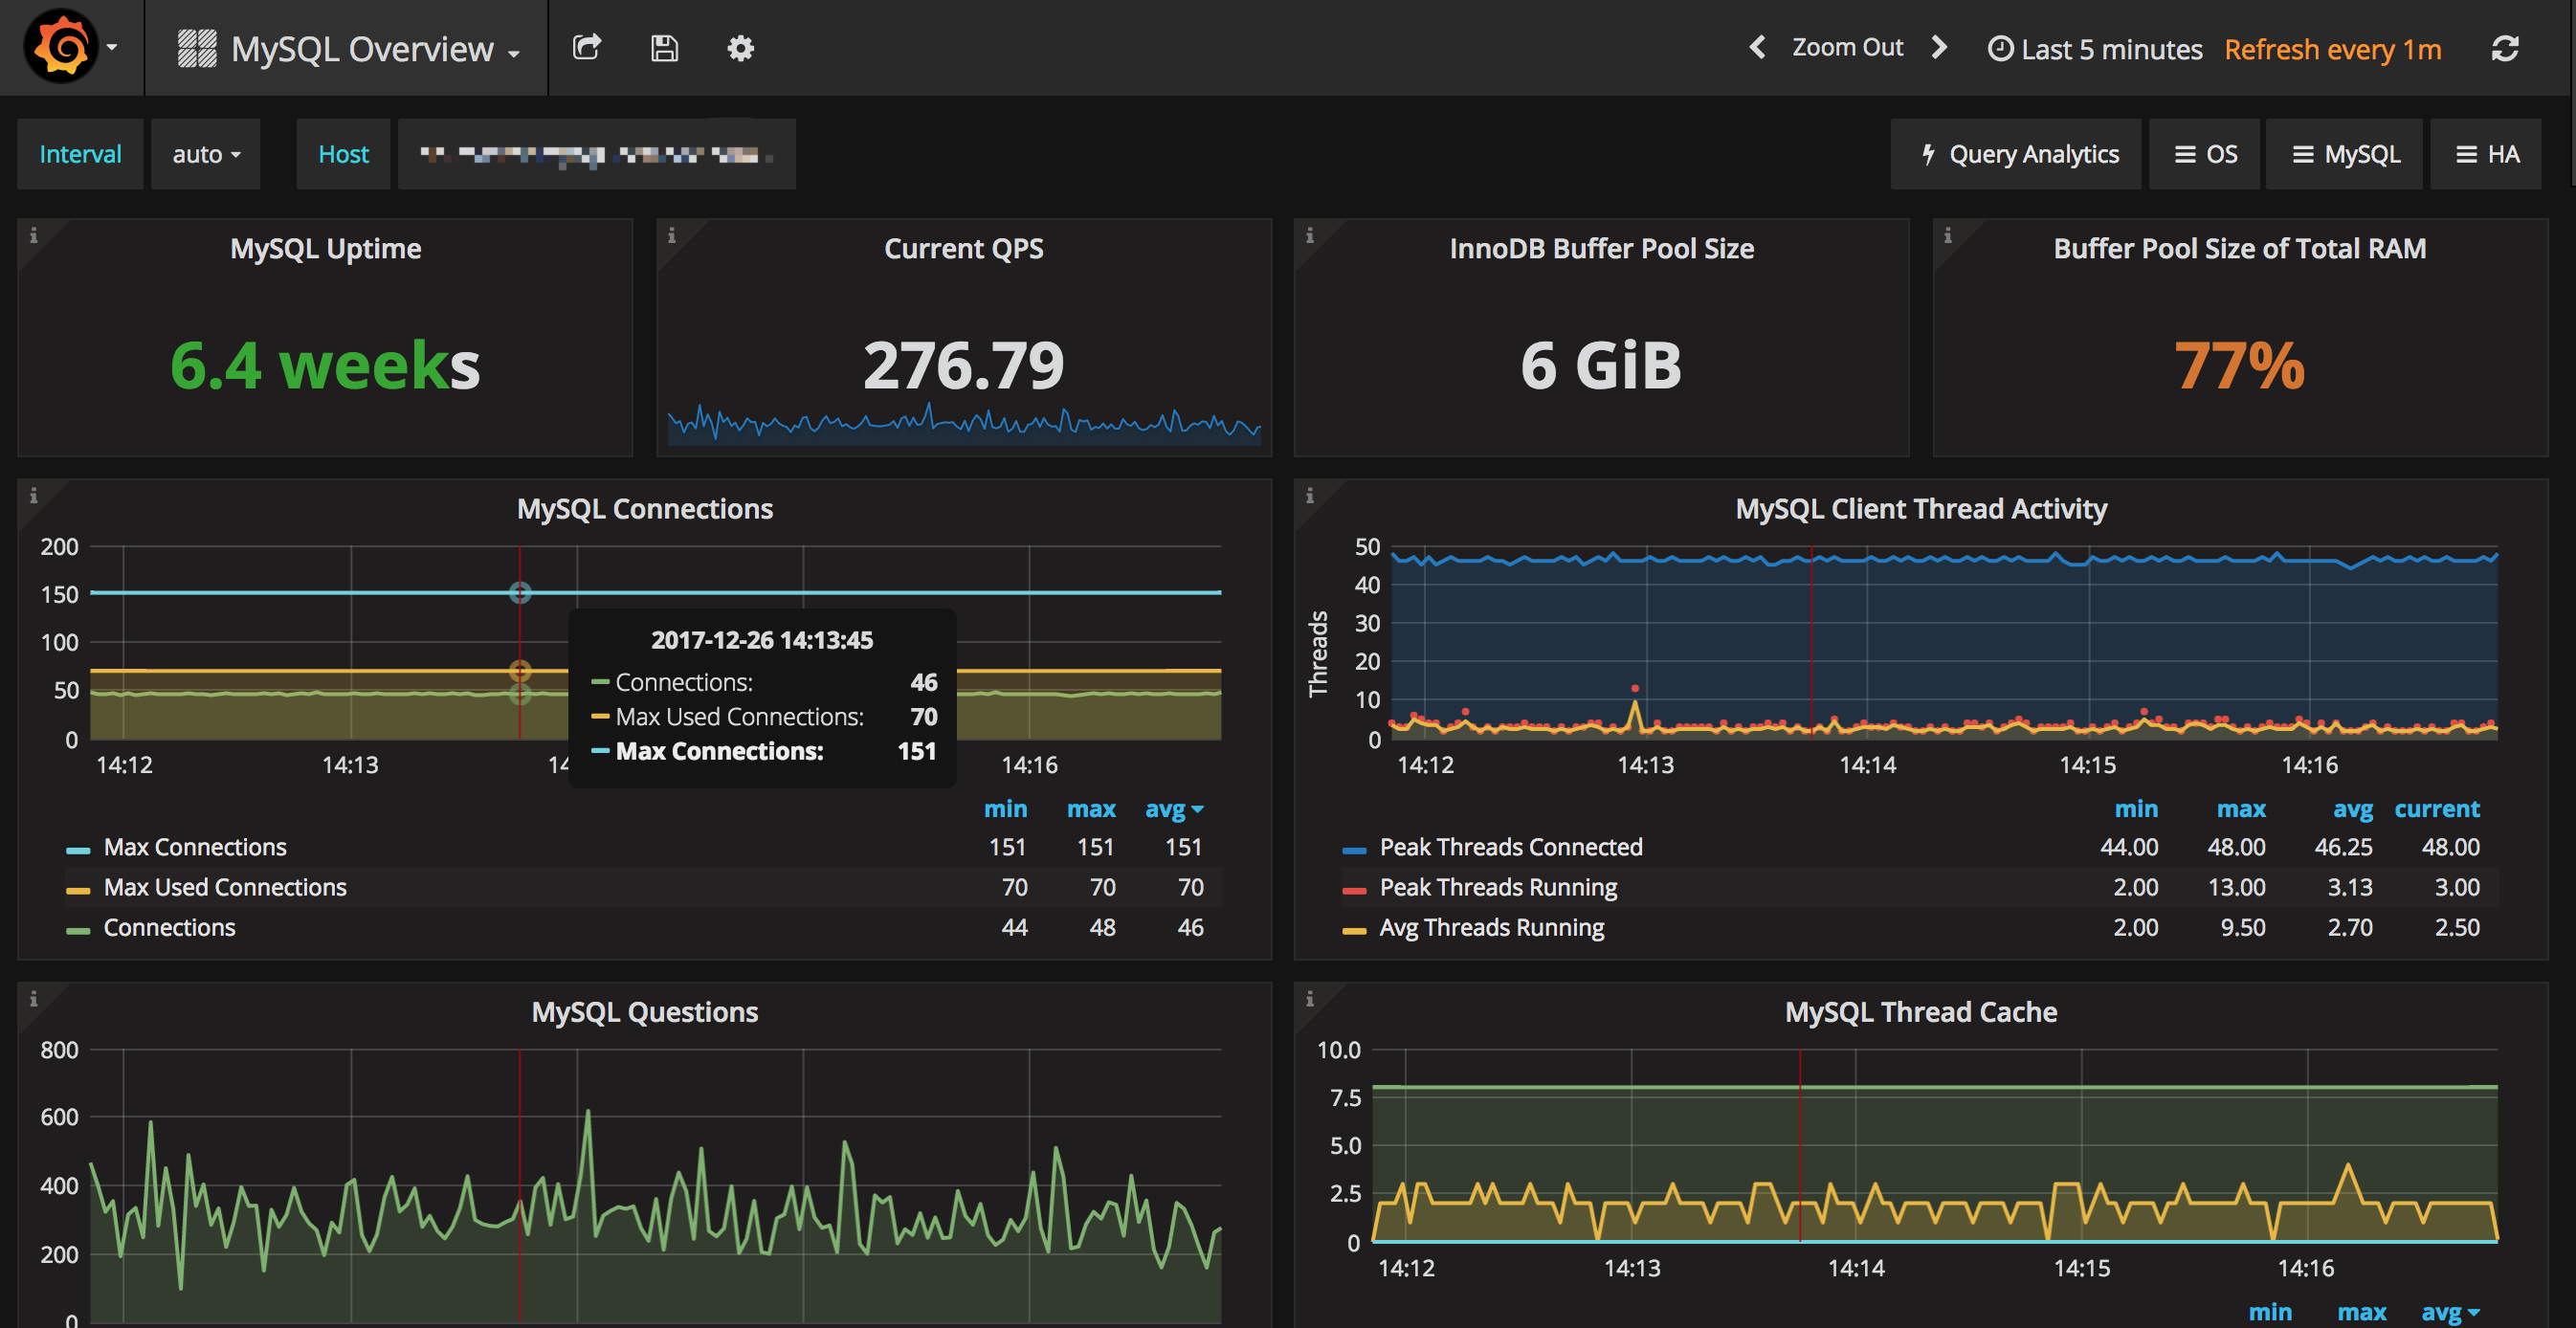
Recently I was exhausted about the Page Cleaner in MySQL issue, and in the end I just surrendered and installed this PMM and keep on monitoring. I thought I was able to solve everything via simple show innodb engine status and show global variables/status, etc.
But the reality showed me as a fool of wasting time on just viewing numbers flipping. I learned one thing from this: never try to hack it before you really fully master it, which is only WAST OF TIME. Time really matters.
This is a quick notes for you to quickly install PMM and start monitoring your MySQL.
As usual, picture always show first!

Beautiful, uh? 😀
1. Architecture Diagram
2. Install PMM Server
Server could install to any server, to be able to aggregate metrics and show web page with diagrams.
2.1. Install using Docker
Before this you need a docker environment and add current user as docker group.
Please refer to: How To Install and Use Docker on Ubuntu 16.04
After you install Docker in Ubuntu, please add --iptables=false to ExecStart=/usr/bin/dockerd -H fd:// in file /etc/systemd/system/multi-user.target.wants/docker.service, or you can’t use UFW to control iptable rules as you would like 😥. For more info, please review:
https://github.com/moby/moby/issues/4737#issuecomment-232362106
But from my own experiment, it shows me as if I configure net.ipv4.ip_forward=1 in /etc/sysctl.conf, then it means IP FORWARD will be open itself, but not by Docker, so docker( > 1.13.x ) won’t add a iptables -P FORWARD DROP by default, since Docker itself will think, FORWARD is not opened by me, if it’s opened by default, then it’s mean to be open there and Docker itself won’t change that behavior.
For other ways to install PMM server, eg. AWS, please refer to: Installing PMM Server
Let start!
Pull the image of
pmm-server1
docker pull percona/pmm-server:latest
Create
pmm-datacontainer for persistent PMM data1
2
3
4
5
6
7docker create \
-v /opt/prometheus/data \
-v /opt/consul-data \
-v /var/lib/mysql \
-v /var/lib/grafana \
--name pmm-data \
percona/pmm-server:latest /bin/trueLaunch PMM Server
METRICS_RETENTION only keeps 1 week data.METRICS_MEMORY will make sure pmm server use up to 393216*3/2KB = 576MB.
1 | docker run -d \ |
the above -p 8081:80 maps local 8081 port to container 80 port.
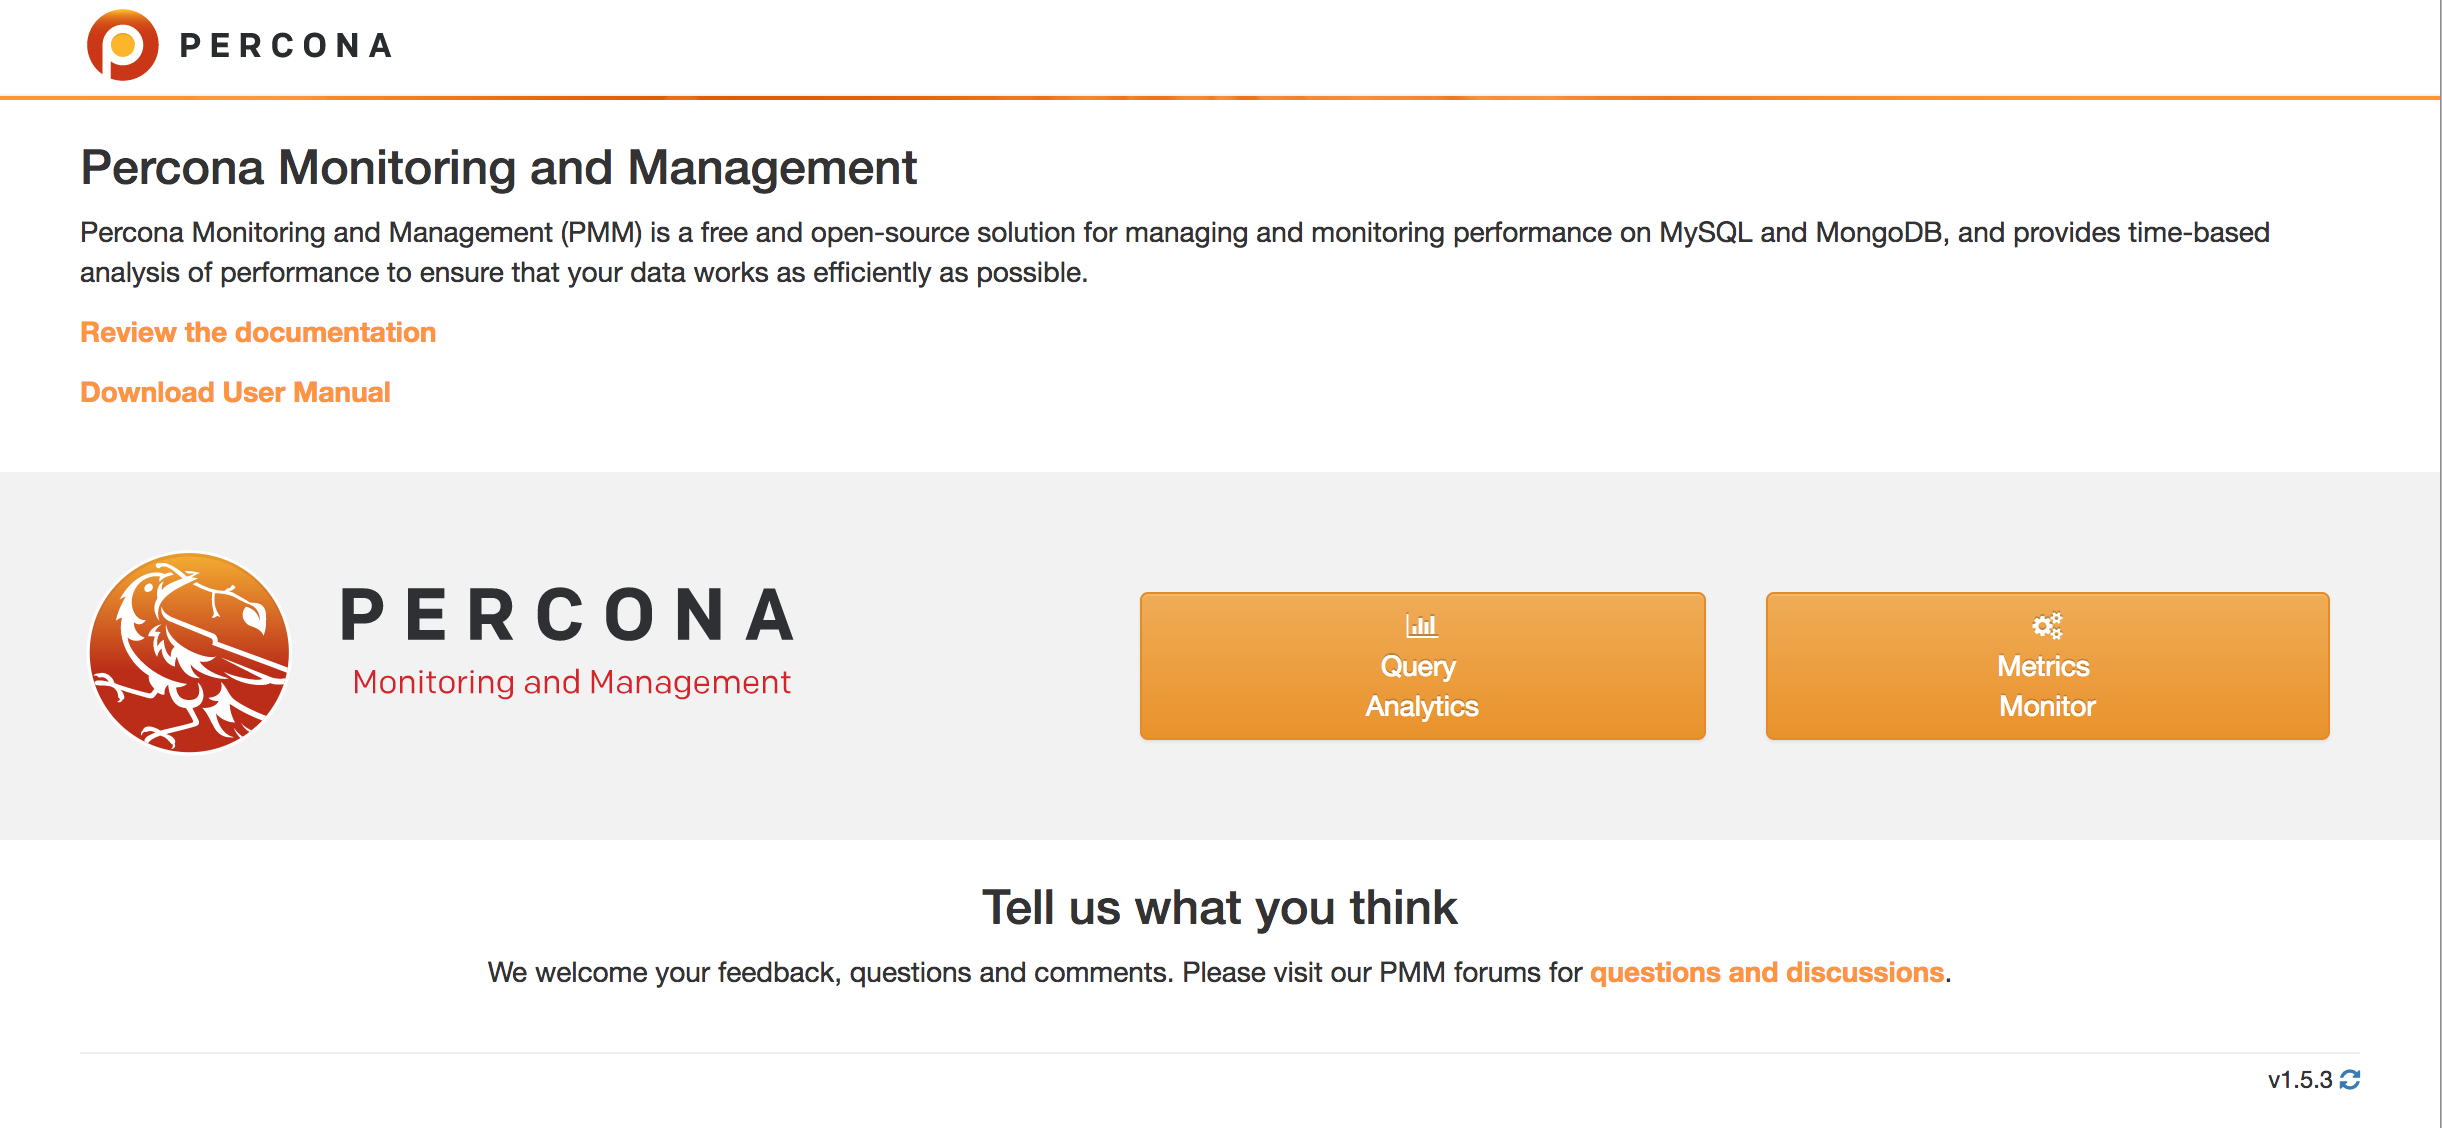
After above steps, you open your ${IP}:8081, you should be able to see start page of Percona Monitoring and Management.

For more, please refer to:
https://www.percona.com/doc/percona-monitoring-and-management/deploy/server/docker.setting-up.html#additional-parameters
3. Install PMM Client
Client has to be install into the MySQL Server instance host.
3.1. Ubuntu
Configure Repo
1
2
3
4
wget https://repo.percona.com/apt/percona-release_0.1-4.$(lsb_release -sc)_all.deb
sudo dpkg -i percona-release_0.1-4.$(lsb_release -sc)_all.deb
sudo apt-get update
sudo apt-cache search perconaYou should be able to see next output:
1
2
3
4
percona-xtrabackup-dbg - Debug symbols for Percona XtraBackup
percona-xtrabackup-test - Test suite for Percona XtraBackup
percona-xtradb-cluster-client - Percona XtraDB Cluster database client
...Install Client
1
sudo apt-get install pmm-client
Configure Client
1
2
3
4
5
6
pmm-admin config --server 192.168.100.1:8081 # here the port is your server port in PMM server, please notice the firewall rules
OK, PMM server is alive.
PMM Server | 192.168.100.1
Client Name | ubuntu-amd641
Client Address | 192.168.200.1Add MySQL Instance to Monitor
Add the mysql instance by usingpmm-admin1
2
3
4
5
6
7
8
9
10
11
12
13
14
15
16
17pmm-admin add mysql --user root --password xxxxxxx
## plaese add `--disable-tablestats` if you do have lots of tables, like > 300, or tablestats monotiring will take some time.
pmm-admin list # Please note, client address must be correct NIC IP, can't be an IP which pmm-server can't reach
pmm-admin 1.5.3
PMM Server | ***.***.***.***:8081
Client Name | ***.***.***.***
Client Address | ***.***.***.***
Service Manager | linux-systemd
-------------- ----------------------------- ----------- -------- ------------------------------------------- ------------------------------------------
SERVICE TYPE NAME LOCAL PORT RUNNING DATA SOURCE OPTIONS
-------------- ----------------------------- ----------- -------- ------------------------------------------- ------------------------------------------
mysql:queries ***.***.***.*** - YES root:***@unix(/var/run/mysqld/mysqld.sock) query_source=slowlog, query_examples=true
linux:metrics ***.***.***.*** 42000 YES -
mysql:metrics ***.***.***.*** 42002 YES root:***@unix(/var/run/mysqld/mysqld.sock)
For more commands for pmm-admin, please review:
https://www.percona.com/doc/percona-monitoring-and-management/pmm-admin.html#managing-pmm-client
4. Ports and Set Firewall Rules
Next ports has to be opened on PMM Client host to PMM Server IP.
| Port | Meaning |
|---|---|
| 42000 | For PMM to collect general system metrics |
| 42001 | This port is used by a service which collects query performance data and makes it available to QAN |
| 42002 | For PMM to collect MySQL server metrics |
| 42003 | For PMM to collect MongoDB server metrics |
| 42004 | For PMM to collect ProxySQL server metrics |
These lines need to be executed in PMM client host, and ***.***.***.*** is PMM server host, to only enable fetching metrics by PMM Server.1
2
3
4
5ufw allow proto tcp from ***.***.***.*** to any port 42000
ufw allow proto tcp from ***.***.***.*** to any port 42001
ufw allow proto tcp from ***.***.***.*** to any port 42002
ufw allow proto tcp from ***.***.***.*** to any port 42003
ufw allow proto tcp from ***.***.***.*** to any port 42004
This line needs to be executed in PMM Server host, and ***.***.***.*** is the PMM client host, to only enable client to access PMM Server 8081 port.1
2ufw allow proto tcp from ***.***.***.*** to any port 8081
ufw reject proto tcp to any port 8081
For more info, please refer to:
https://www.percona.com/doc/percona-monitoring-and-management/glossary.terminology.html#term-ports
5. Email Alert Configuration
Go into docker instance and vi /etc/grafana/grafana.ini:1
2
3
4
5
6
7
8
9
10
11
12
13
14
15
16
17
18# The full public facing url you use in browser, used for redirects and emails
# If you use reverse proxy and sub path specify full url (with sub path)
root_url = https://xxx.xxx.xxx/graph/ # This is your domain name
#################################### SMTP / Emailing ##########################
[smtp]
enabled = true
host = smtp.gmail.com:465
user = username # without @gmail.com
# If the password contains # or ; you have to wrap it with trippel quotes. Ex """#password;"""
password = stwixlxwxnmimfsfsf @ this is your app password
;cert_file =
;key_file =
skip_verify = false
from_address = username@gmail.com
from_name = Grafana
# EHLO identity in SMTP dialog (defaults to instance_name)
ehlo_identity = xxx.xxx.xxx # again your domain name
NOTE: please do next things for your gmail:
- Enable IMAP/SMTP
- Open 2 factor login for Google Account
- Config app password for gmail and place above
6. Nginx Forward Port and Setup HTTP Auth
Actually we still need the HTTPS setup, but that’s beyond our topic here.
Setup Nginx by using
apt-get install nginxand then setup next site-conf1
2
3
4
5
6
7
8
9
10
11
12
13
14
15
16
17
18
19
20
21
22
23
24
25
26server {
listen 80 ;
listen [::]:80 ;
server_name ***.***.domain_name;
return 301 https://***.***.domain_name$request_uri;
}
server {
listen 443 ssl;
listen [::]:443 ssl;
server_name ***.***.domain_name;
ssl_certificate /etc/nginx/ssl/self-domain.crt;
ssl_certificate_key /etc/nginx/ssl/self-domain.key;
access_log /var/log/nginx/pmm.access.log;
error_log /var/log/nginx/pmm.error.log;
auth_basic "Restricted Content";
auth_basic_user_file /etc/nginx/.htpasswd;
location / {
include /etc/nginx/proxy_params;
proxy_set_header Authorization "";
proxy_pass http://localhost:8081;
proxy_read_timeout 90s;
}
}Setup http auth
1
2
3echo -n 'user1:' >> /etc/nginx/.htpasswd
# input password for `user1` twice here, as `pass1`
echo "pass1\npass1\n" | openssl passwd -apr1 -stdin >> /etc/nginx/.htpasswdReload Nginx
1
2
nginx -t
nginx -s reload
7. Highlights and Conclusion
PMMis powerful to monitor MySQL- Use
--iptables=falseif you install Docker into Ubuntu OS, which again, proves, CentOS is designed for Server. - We can use
opensslto setup http password file - Use
proxy_set_header Authorization "";to remove the http auth header